EE
2170: Design and Analysis of Signals and Systems
Design of a 10-band Graphic
Equalizer
Instructor: Carlos Davila
Dept. of Electrical Engineering, Southern
Methodist University
The object of this lab
is to design a 10-band graphic equalizer. This is a two-week lab[1]. Graphic equalizers are used extensively in
the music industry for recording, performance, and high-end audio applications.
The following links give information about equalizers and bandpass filters:
- Equalizer basics from Rane Corp.
- Equalization (focus on this link)
- Equalizers from Tonmeister
- TOA professional graphic
equalizer specs.
In this lab, we will
use Simulink to rapidly prototype a 10-band graphic equalizer. Most commercial
equalizers use either 1/3 octave or 2/3 octave bandpass filters. We will design
one octave bandpass filters. Following are the design specifications for the
equalizer:
1. Using Matlab, design 10 different bandpass filters having center
frequencies of 31.5 Hz, 63 Hz, 125 Hz, 250 Hz, 500 Hz, 1000 Hz, 2000 Hz, 4000
Hz, 8000 Hz, and 16000 Hz. These center frequencies correspond to the ISO
(International Standards Organization) standard for graphic equalizer center
frequencies.
2. The bandwidth for each filter is measured as the frequency difference
f2 – f1 > 0 where f2 and f1
correspond to the frequencies where the gain is down 3 dB from the maximum gain
(12 dB) at the center frequency. Choose f1 and f2 such
that the center frequency, fc corresponds to the geometric mean of f1
and f2, i.e. fc = (f1f2)1/2.
3. The center frequency gain for each bandpass filter should vary between +12 dB and -12 dB (i.e. the filters have both “boost” and “cut”). Use a slider gain block to adjust the gain between these two settings. The filter gain in dB corresponds to:
![]()
4. The passband gain of the equalizer when all bandpass filters are at
0dB gain (each slider is in the center position) should vary by no more than ![]() 1 dB.
1 dB.
Each bandpass filter
can be designed using the matlab command “butter”. The following comes from the
Matlab help file:
“[b,a] = butter(n,Wn,'s') designs an order n
lowpass analog Butterworth filter with angular cutoff frequency Wn rad/s. It
returns the filter coefficients in the length n+1 row vectors b and a, in
descending powers of s, derived from this transfer function:

butter's angular cutoff frequency Wn must be
greater than 0 rad/s. If Wn is a two-element vector with w1 < w2,
butter(n,Wn,'s') returns an order 2*n bandpass analog filter with passband w1
< w < w2”
Implement each
bandpass filter in Simulink and connect them in parallel and sum their outputs
as shown in the following image:
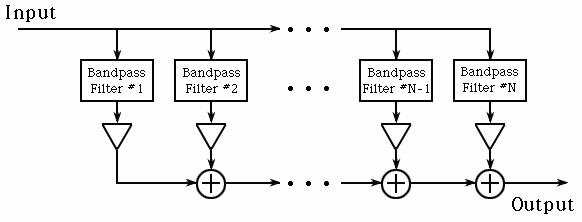
The “triangles”are
boost/cut aimplifiers. To test your design, plot the frequency response, both
magnitude and phase, of each of the 10 bandpass filters using the Matlab
function “freqs”. The frequency response is just H(s) with s = jW, where H(s) is the
100% Extra Credit
Project: Design a 10-band
constant-Q graphic equalizer. To do this you will have to learn about
s-functiosn in Simulink help. Each bandpass filter will have to alter its
characteristics as its gain is modified in order to maintain a constant quality
factor (Q):
![]()